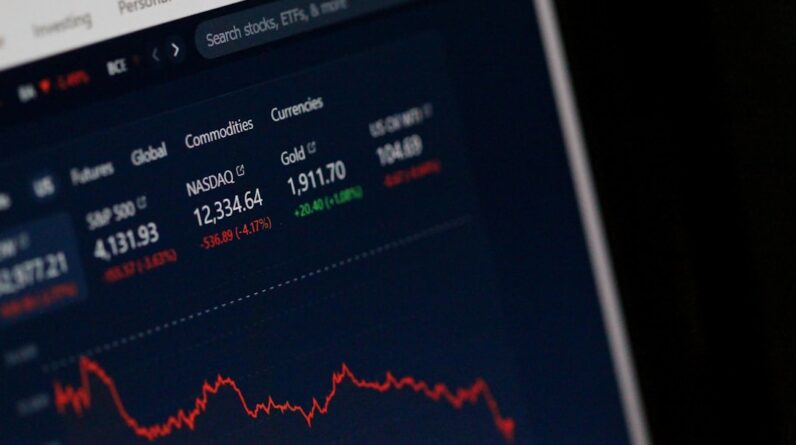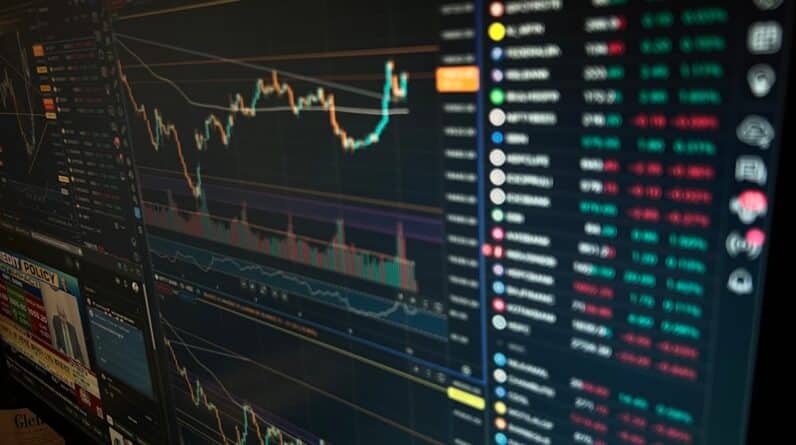
When you embark on the journey of trading or investing in financial markets, understanding technical analysis is crucial. At its core, technical analysis is the study of past market data, primarily price and volume, to forecast future price movements. Unlike fundamental analysis, which focuses on a company’s financial health and economic factors, technical analysis relies on charts and indicators to identify patterns and trends.
This approach assumes that all relevant information is already reflected in the price, allowing you to make informed decisions based on historical data. As you delve deeper into technical analysis, you’ll discover that it encompasses various tools and techniques designed to help you interpret market behavior. By analyzing price movements over time, you can identify trends, reversals, and potential entry or exit points for your trades.
The beauty of technical analysis lies in its versatility; whether you’re a day trader looking for short-term gains or a long-term investor seeking to understand market cycles, these principles can be adapted to suit your trading style.
Key Takeaways
- Technical analysis involves analyzing historical price and volume data to predict future price movements.
- Candlestick charts display the open, high, low, and close prices for a specific time period and can help identify market trends.
- Support levels are price points where a stock tends to stop falling, while resistance levels are price points where a stock tends to stop rising.
- Technical indicators such as moving averages and relative strength index (RSI) can help traders identify potential buy or sell signals.
- Chart patterns such as head and shoulders, triangles, and flags can provide insight into potential future price movements.
Reading Candlestick Charts
One of the most powerful tools in technical analysis is the candlestick chart. This type of chart provides a visual representation of price movements over a specific period, allowing you to quickly assess market sentiment. Each candlestick consists of a body and wicks, which represent the opening, closing, high, and low prices for that time frame.
By examining the color and shape of these candlesticks, you can gain insights into market dynamics and potential future movements. As you learn to read candlestick charts, you’ll notice that certain formations can indicate bullish or bearish trends. For instance, a series of green candlesticks may suggest strong buying pressure, while red candlesticks could indicate selling pressure.
Additionally, specific patterns like dojis or hammers can signal indecision or potential reversals in the market. By mastering candlestick patterns, you can enhance your ability to make timely trading decisions based on real-time market conditions.
Identifying Support and Resistance Levels

Support and resistance levels are fundamental concepts in technical analysis that can significantly influence your trading strategy. Support refers to a price level where buying interest is strong enough to prevent the price from falling further, while resistance is a level where selling interest is sufficient to halt upward movement. Identifying these levels can help you determine potential entry and exit points for your trades.
To effectively identify support and resistance levels, you can analyze historical price data and look for areas where the price has previously reversed direction. These levels often act as psychological barriers for traders, as many participants place buy or sell orders around these points. By recognizing these key levels on your charts, you can make more informed decisions about when to enter or exit a trade, ultimately improving your chances of success in the market.
Utilizing Technical Indicators
Technical indicators are essential tools that can enhance your analysis and decision-making process. These mathematical calculations are derived from price and volume data and are designed to provide insights into market trends, momentum, volatility, and more. As you explore various indicators, you’ll find that they can help you confirm signals generated by candlestick patterns or support and resistance levels.
Some popular technical indicators include moving averages, Relative Strength Index (RSI), and Bollinger Bands. Moving averages smooth out price data over a specified period, helping you identify trends more clearly. The RSI measures the speed and change of price movements, indicating whether an asset is overbought or oversold.
By incorporating these indicators into your analysis, you can gain a more comprehensive view of market conditions and make better-informed trading decisions.
Recognizing Chart Patterns
Chart patterns are another critical aspect of technical analysis that can provide valuable insights into future price movements. These patterns form as a result of price action over time and can indicate potential trend reversals or continuations. As you familiarize yourself with various chart patterns, such as head and shoulders, triangles, and flags, you’ll be better equipped to anticipate market behavior.
Recognizing these patterns requires practice and keen observation. For instance, a head and shoulders pattern often signals a reversal from bullish to bearish sentiment, while a triangle pattern may indicate a period of consolidation before a breakout occurs. By learning to identify these formations on your charts, you can position yourself advantageously in the market and increase your chances of making profitable trades.
Interpreting Volume and Market Sentiment
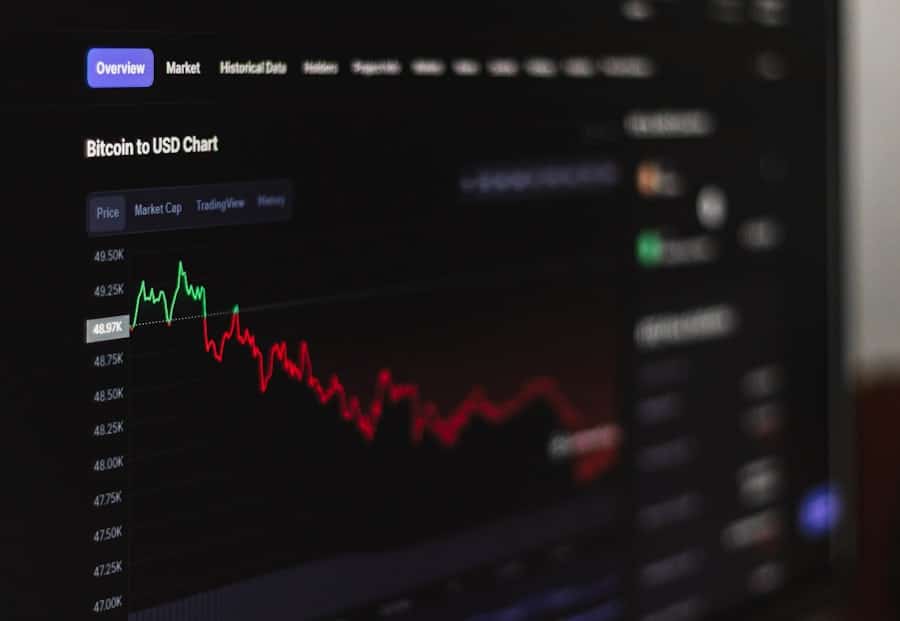
Volume is a crucial component of technical analysis that provides insights into the strength of price movements. It represents the number of shares or contracts traded during a specific period and can help you gauge market sentiment. High volume during an upward price movement suggests strong buying interest, while high volume during a downward movement indicates significant selling pressure.
As you analyze volume alongside price action, you’ll develop a deeper understanding of market dynamics. For example, if a stock breaks through a resistance level with high volume, it may signal a strong bullish trend. Conversely, if a stock approaches support with low volume, it could indicate weakening interest from buyers.
By interpreting volume in conjunction with other technical indicators and chart patterns, you can enhance your ability to make informed trading decisions based on market sentiment.
Applying Trend Analysis
Trend analysis is an essential aspect of technical analysis that involves identifying the direction of price movements over time. Trends can be classified as upward (bullish), downward (bearish), or sideways (consolidation). Understanding the prevailing trend is vital for making informed trading decisions, as it helps you align your strategies with market momentum.
To apply trend analysis effectively, you can use tools such as trendlines and moving averages. Trendlines are drawn by connecting significant highs or lows on your chart, providing visual cues about the direction of the trend. Moving averages can also help smooth out price fluctuations and highlight the overall trend direction.
By recognizing trends early on and adjusting your trading strategies accordingly, you can increase your chances of capitalizing on profitable opportunities in the market.
Incorporating Fundamental Analysis with Technical Analysis
While technical analysis provides valuable insights into price movements and market behavior, incorporating fundamental analysis can further enhance your trading strategy. Fundamental analysis involves evaluating a company’s financial health, economic indicators, and industry trends to assess its intrinsic value. By combining both approaches, you can develop a more comprehensive understanding of the markets.
For instance, if you’re considering investing in a stock that shows bullish technical signals but has weak fundamentals, it may be wise to exercise caution. Conversely, if strong fundamentals align with positive technical indicators, it could present an excellent opportunity for investment. By integrating both technical and fundamental analysis into your decision-making process, you can create a well-rounded trading strategy that accounts for both market sentiment and underlying economic factors.
In conclusion, mastering technical analysis requires dedication and practice. By understanding its basics, reading candlestick charts effectively, identifying support and resistance levels, utilizing technical indicators, recognizing chart patterns, interpreting volume and market sentiment, applying trend analysis, and incorporating fundamental analysis into your strategy, you will be well-equipped to navigate the complexities of financial markets. As you continue to refine your skills in technical analysis, you’ll find yourself making more informed trading decisions that align with your investment goals.
FAQs
What is cryptocurrency technical analysis?
Cryptocurrency technical analysis is the study of past market data, primarily price and volume, to forecast future price movements. It involves using charts and statistical indicators to identify patterns and trends in the market.
Why is cryptocurrency technical analysis important?
Cryptocurrency technical analysis is important because it helps traders and investors make informed decisions about buying, selling, or holding cryptocurrencies. It provides insights into market sentiment and potential price movements.
What are the key components of a cryptocurrency technical analysis?
The key components of a cryptocurrency technical analysis include price charts, support and resistance levels, trend lines, moving averages, and various technical indicators such as RSI, MACD, and Bollinger Bands.
How can I learn to read a cryptocurrency technical analysis?
You can learn to read a cryptocurrency technical analysis by studying chart patterns, understanding different technical indicators, and practicing analysis on historical data. There are also many online resources, courses, and books available on the subject.
What are some common technical indicators used in cryptocurrency analysis?
Some common technical indicators used in cryptocurrency analysis include Relative Strength Index (RSI), Moving Average Convergence Divergence (MACD), Bollinger Bands, Fibonacci retracement levels, and stochastic oscillators.
How accurate is cryptocurrency technical analysis in predicting price movements?
The accuracy of cryptocurrency technical analysis in predicting price movements varies and is not guaranteed. It is important to use technical analysis in conjunction with other forms of analysis and risk management strategies.