
When you first delve into the world of cryptocurrency trading, one of the most essential skills you need to develop is the ability to read and interpret crypto charts. These charts serve as visual representations of price movements over time, allowing you to analyze past performance and make informed predictions about future trends. At their core, crypto charts display price data, typically in the form of candlesticks or line graphs, which can help you identify patterns and trends that may influence your trading decisions.
To effectively utilize crypto charts, you must familiarize yourself with the various components that make up these visual tools. The x-axis usually represents time, while the y-axis indicates price levels. Each candlestick or data point provides crucial information about the opening, closing, high, and low prices within a specific timeframe.
By understanding these elements, you can begin to decipher the market’s behavior and gain insights into potential price movements. As you become more comfortable with reading charts, you’ll find that they can be invaluable in guiding your trading strategies.
Key Takeaways
- Crypto charts provide visual representations of price movements and are essential for understanding market trends and patterns.
- Key chart patterns such as head and shoulders, triangles, and flags can help identify potential trend reversals or continuations.
- Technical indicators like moving averages, RSI, and MACD can provide valuable insights into market momentum and potential price direction.
- Fundamental analysis, including news and events, can impact price movements and should be considered alongside chart analysis.
- Market sentiment and news can have a significant impact on chart patterns and should be monitored for potential trading opportunities.
Identifying Key Chart Patterns and Trends
Identifying Chart Patterns and Trends is Crucial for Trading Success
Recognizing Key Chart Patterns
Once you have a solid understanding of the basics, the next step is to identify key chart patterns and trends that can signal potential trading opportunities. Patterns such as head and shoulders, double tops, and triangles can provide valuable insights into market sentiment and potential reversals. For instance, a head and shoulders pattern often indicates a trend reversal from bullish to bearish, while a double bottom may suggest a shift from bearish to bullish sentiment.
Understanding Market Trends
Recognizing these patterns can help you make more informed decisions about when to enter or exit a trade. In addition to specific patterns, it’s crucial to pay attention to broader trends in the market. Trends can be classified as upward (bullish), downward (bearish), or sideways (consolidation).
Aligning Your Trading Strategy with the Prevailing Trend
By identifying the prevailing trend, you can align your trading strategy accordingly. For example, if the market is in a strong upward trend, you may want to focus on buying opportunities rather than short-selling. Conversely, in a bearish market, it may be more prudent to look for short positions or wait for signs of a reversal before entering the market.
Utilizing Technical Indicators for Analysis
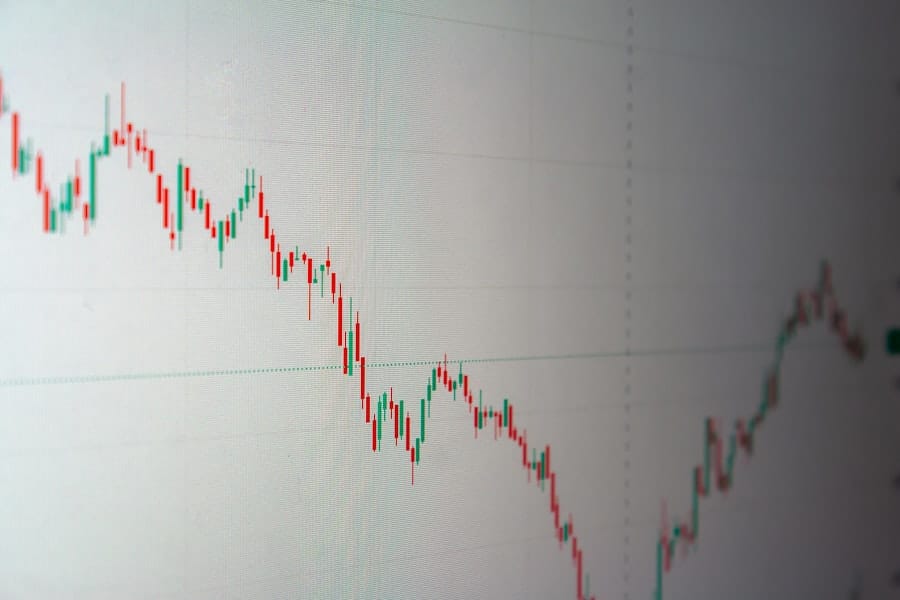
To enhance your chart analysis further, incorporating technical indicators can provide additional layers of insight into market dynamics. Indicators such as moving averages, Relative Strength Index (RSI), and Bollinger Bands can help you gauge momentum, volatility, and potential price reversals. For instance, moving averages smooth out price data over a specified period, allowing you to identify trends more clearly.
When the short-term moving average crosses above a long-term moving average, it may signal a bullish trend, while the opposite crossover could indicate a bearish trend. The RSI is another powerful tool that measures the speed and change of price movements. It ranges from 0 to 100 and is typically used to identify overbought or oversold conditions in the market.
An RSI above 70 may suggest that an asset is overbought and due for a correction, while an RSI below 30 could indicate that it is oversold and may be poised for a rebound. By combining these indicators with your chart analysis, you can develop a more comprehensive understanding of market conditions and make more informed trading decisions.
Incorporating Fundamental Analysis into Chart Interpretation
While technical analysis focuses on price movements and patterns, fundamental analysis examines the underlying factors that influence an asset’s value. To become a well-rounded trader, it’s essential to incorporate fundamental analysis into your chart interpretation. This involves evaluating factors such as project developments, regulatory news, market demand, and macroeconomic trends that could impact the cryptocurrency market.
For example, if a major cryptocurrency exchange announces support for a new token or if there are significant technological advancements within a blockchain project, these developments can lead to increased demand and subsequently drive up prices. By staying informed about the fundamental aspects of the cryptocurrencies you are trading, you can better contextualize the price movements you observe on your charts. This holistic approach will enable you to make more informed decisions based on both technical signals and fundamental factors.
Recognizing Market Sentiment and News Impact on Charts
Market sentiment plays a crucial role in shaping price movements in the cryptocurrency space. Understanding how news events and social media trends can influence sentiment is vital for effective chart analysis. Positive news, such as institutional adoption or favorable regulatory developments, can lead to bullish sentiment and drive prices higher.
Conversely, negative news or market fears can trigger panic selling and result in sharp declines. To stay ahead of market sentiment shifts, it’s essential to monitor news sources, social media platforms, and community discussions related to cryptocurrencies. Tools like sentiment analysis platforms can help you gauge overall market sentiment by analyzing social media posts and news articles.
By recognizing how sentiment impacts price movements on your charts, you can make more informed trading decisions that align with prevailing market conditions.
Setting Clear Entry and Exit Points Based on Chart Analysis
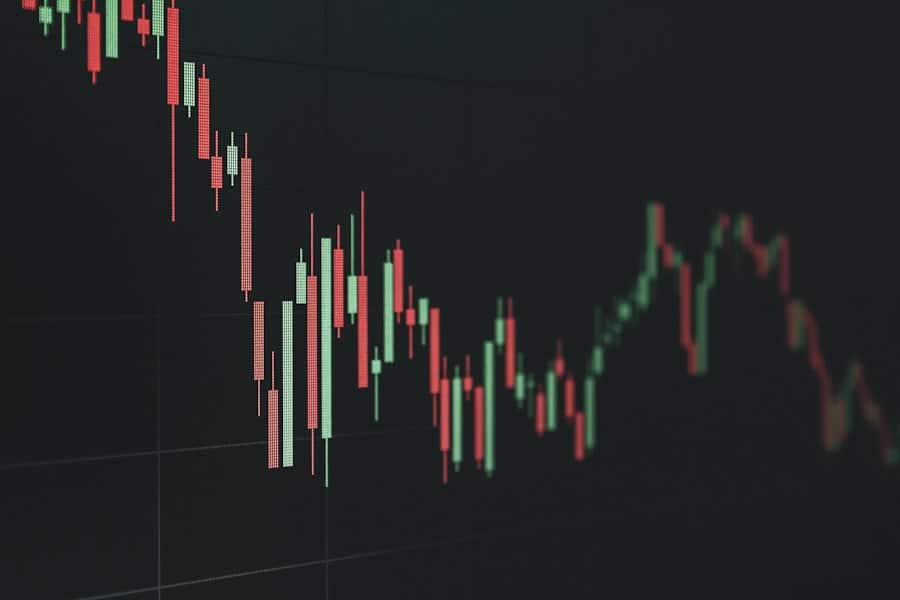
One of the most critical aspects of successful trading is establishing clear entry and exit points based on your chart analysis. This involves determining specific price levels at which you will enter a trade (buy) or exit a trade (sell). By setting these points in advance, you can avoid emotional decision-making during periods of volatility.
When setting entry points, consider using support and resistance levels identified on your charts. Support levels are price points where buying interest tends to emerge, while resistance levels are where selling pressure often arises. By entering trades near support levels during bullish trends or near resistance levels during bearish trends, you increase your chances of success.
Similarly, establishing exit points based on profit targets or stop-loss orders can help you manage risk effectively while maximizing potential gains.
Implementing Risk Management Strategies in Decision Making
Risk management is an essential component of any trading strategy. As you analyze crypto charts and make trading decisions, it’s crucial to implement risk management strategies that protect your capital from significant losses. One common approach is to determine your risk-reward ratio before entering a trade.
This ratio compares the potential profit of a trade to the potential loss if the trade goes against you. For instance, if you’re willing to risk $100 on a trade with the potential for a $300 profit, your risk-reward ratio would be 1:3. This means that for every dollar you risk, you’re aiming for three dollars in return.
By maintaining favorable risk-reward ratios across your trades, you can ensure that even if some trades result in losses, your overall profitability remains intact. Additionally, consider diversifying your portfolio across different cryptocurrencies rather than concentrating all your capital in one asset. Diversification helps mitigate risk by spreading exposure across various assets with different price behaviors.
This way, if one asset underperforms, others may compensate for those losses.
Continuously Monitoring and Adapting to Chart Developments
The cryptocurrency market is highly dynamic and can change rapidly due to various factors such as news events or shifts in market sentiment. Therefore, it’s essential to continuously monitor your charts and adapt your strategies accordingly. Regularly reviewing your trades and analyzing their outcomes will help you refine your approach over time.
As new data becomes available or as market conditions shift, be prepared to adjust your entry and exit points based on updated chart analysis. Staying flexible allows you to capitalize on emerging opportunities while minimizing potential losses from unfavorable developments. By maintaining an adaptive mindset and being proactive in your trading approach, you’ll be better equipped to navigate the complexities of the cryptocurrency market successfully.
In conclusion, mastering crypto charts requires a combination of technical analysis skills, fundamental understanding, and an awareness of market sentiment. By developing these skills and implementing effective risk management strategies, you can enhance your trading performance and make more informed decisions in this exciting yet volatile market. Remember that continuous learning and adaptation are key components of successful trading; stay engaged with the latest developments in both technical analysis and the broader cryptocurrency landscape to maximize your potential for success.
FAQs
What are crypto charts?
Crypto charts are visual representations of the price movements of cryptocurrencies over a certain period of time. They typically show the opening price, closing price, high price, and low price for a specific time frame, such as 1 hour, 1 day, 1 week, etc.
How can I analyze crypto charts?
You can analyze crypto charts by looking at various technical indicators such as moving averages, RSI (Relative Strength Index), MACD (Moving Average Convergence Divergence), and volume. These indicators can help you identify trends, momentum, and potential reversal points in the price of a cryptocurrency.
What are some common chart patterns to look for?
Some common chart patterns to look for when analyzing crypto charts include head and shoulders, double tops and bottoms, triangles, flags, and pennants. These patterns can provide insights into potential price movements and trend reversals.
How can I make informed decisions using crypto charts?
To make informed decisions using crypto charts, it’s important to combine technical analysis with fundamental analysis. This means considering both the price movements on the charts as well as the underlying factors that may impact the value of a cryptocurrency, such as news, market sentiment, and technological developments.
What are some tools and resources for analyzing crypto charts?
There are various tools and resources available for analyzing crypto charts, including charting platforms like TradingView, technical analysis software like Coinigy, and educational resources such as online courses and tutorials on technical analysis. It’s important to use reliable and reputable sources for chart analysis to make informed decisions.